Snowball Analytics vs. The Dividend Tracker
If you have outgrown a spreadsheet for tracking dividend income, two apps often come up: Snowball Analytics and The Dividend Tracker (TDT). Both track your holdings and estimate upcoming payouts, and both have a free plan for small portfolios. They differ in focus: TDT is built around dividend income, alerts and a community of dividend investors, while Snowball Analytics leans towards portfolio management, with rebalancing, wider market coverage and IRR-based performance tracking.
Short answer
Dividend investors with mostly US, Canadian or UK stocks who want monthly income estimates, dividend alerts and an investor community.
Suits investors who want a clear view of monthly dividend income on the web or on their phone, several portfolios on the entry plan, and AI-assistant integration built in.
Investors with holdings in several currencies or on non-US exchanges who want IRR-based performance and a rebalancing tool with target allocations.
Suits investors who want to see total performance alongside income, manage target allocations, and test a portfolio on historical data.
Comparison at a glance
| Feature | Snowball Analytics | The Dividend Tracker (TDT) |
|---|---|---|
| Main focus | Portfolio tracking, performance (IRR) and rebalancing, plus dividends | Dividend income tracking, alerts and investor community |
| Broker connection | Yodlee, SnapTrade and Plaid on paid plans; broker report and CSV import on all plans | Auto-import through SnapTrade or Plaid on paid plans; CSV import on all plans |
| Markets & currencies | 30+ currencies, 70+ exchanges | US, Canadian and UK exchanges and currencies |
| Dividend safety score | Dividend Rating based on 13 fundamental indicators from company financial statements (from Starter) | Dividend Grades (from Premium) |
| Performance metrics | IRR on all plans; returns include fees, dividends and trades | Realised gains and dividend income by year; advanced metrics on paid plans |
| Rebalancing tool | Target allocations, rebalancing suggestions and “Find the Dip”, which shows holdings below their target | Not listed; offers income goals and, on paid plans, calculators |
| Backtesting | All plans: 10 years of data; 30+ years on Investor and Expert | Long-range backtests on Pro |
| Free plan | 1 portfolio, 10 holdings; broker report import, dividend calendar, purchases-only rebalancing | 1 portfolio, 10 holdings; CSV import, limited payout calendar |
| Billed monthly* | Starter $7.99 / Investor $14.99 / Expert $24.99 | Premium $8.99 / Pro $16.95 |
| Billed annually | $6.67 / $12.50 / $20.83 a month ($79.99 / $149.99 / $249.99 a year) | $7.50 / $14.13 a month ($89.99 / $169.50 a year) |
| Portfolios on paid plans | 1 (Starter) / 10 (Investor) / unlimited (Expert) | 10 (Premium) / 30 (Pro) |
| Before you pay | 14-day free trial, no card | No trial; 14-day money-back guarantee on upgrades |
* Prices in USD as listed on each company's pricing page on October 21, 2026. In-app prices in the App Store or Google Play can differ slightly. Check the vendor's site before you subscribe.
Income versus total return
Why income alone can mislead
The yield trap. A chart of growing dividend income shows only part of the picture. For example, a holding that yields 12% while its share price falls by 40% has a total return of roughly −28% before tax, even though the income chart looks healthy. Whichever app you use, look at total return alongside income.
How each app shows it
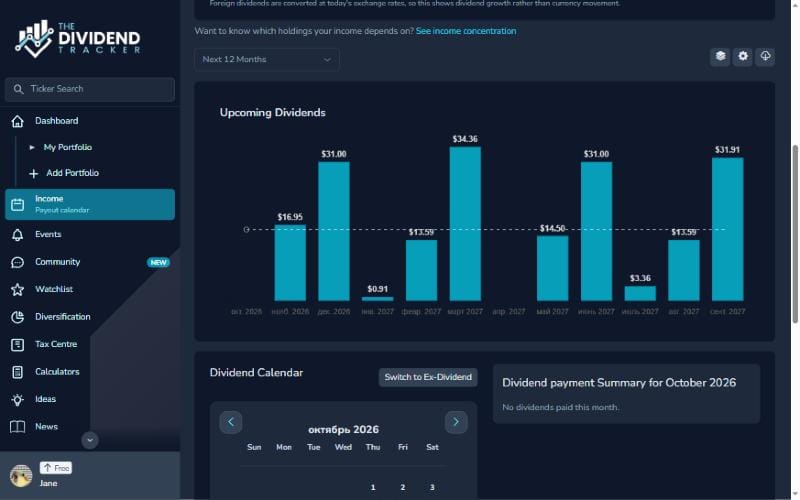
TDT's dashboard centres on dividend income, with payouts broken down by month and year and filters for estimated, declared and confirmed dividends. Its Tax Centre adds realised gains and dividend income by year.
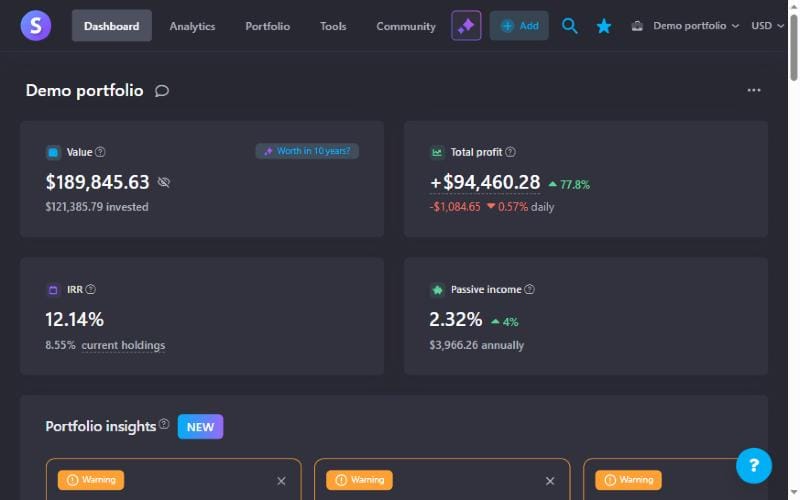
Snowball Analytics puts performance alongside income. It calculates IRR and includes fees, dividends and trades in portfolio returns, so a falling share price shows up next to the income it pays.
Dividend safety scores
Snowball Analytics Dividend Rating vs. TDT Dividend Grades
Both apps include a score meant to help you judge how reliable a company's dividend is. TDT's Dividend Grades, included from the Premium plan, give safety and growth ratings for each payer you hold or watch.
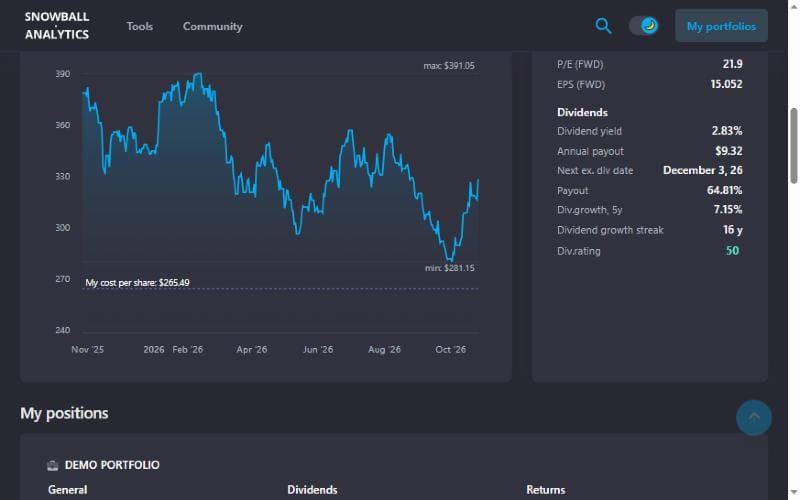
The Snowball Analytics Dividend Rating, included from the Starter plan, combines 13 fundamental indicators calculated from company financial statements, covering the dividend itself, debt, cash flow and growth. A lower rating means weaker financial stability, which is worth a closer look. It is not a forecast. Company fundamentals go back 5 years on Free and Starter and 10 years on Investor and Expert.
Neither score is a recommendation to buy or sell; treat it as one input for your own research.
Getting your data in
Broker connections and missing history
Both apps can sync with brokers through aggregators on paid plans: Snowball Analytics uses Yodlee, SnapTrade and Plaid, and TDT names SnapTrade and Plaid for brokers in the US, Canada and Europe. Connections like these are convenient, but they often expose only recent activity. The Snowball Analytics help center notes that most brokers share only 90 to 200 days of transaction history this way. Other aggregator-based connections can have similar limits, so check how much history your broker shares before relying on it for cost basis.
Importing full history
For an accurate cost basis and yield on cost going back years, import full broker statements. Snowball Analytics accepts reports from supported brokers or a custom CSV file. Interactive Brokers accounts connect through Yodlee using a query ID and token from your IBKR account. TDT supports CSV import on all plans and CSV export on paid plans.
Managing a portfolio, not just tracking it
Target allocations and rebalancing
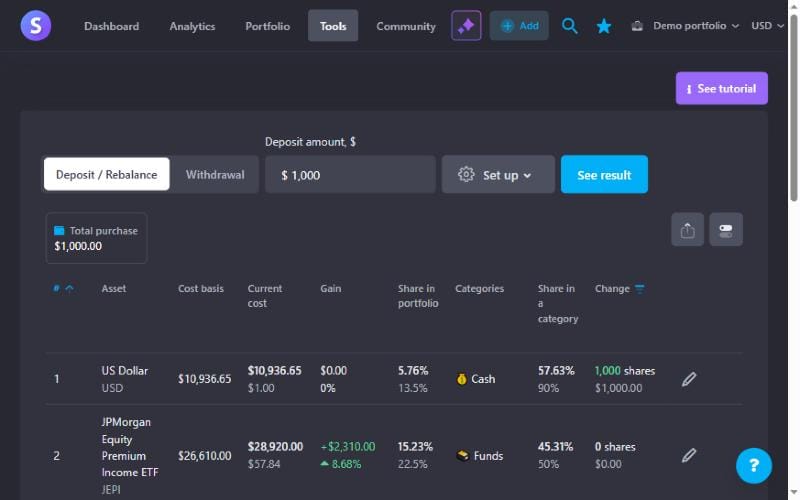
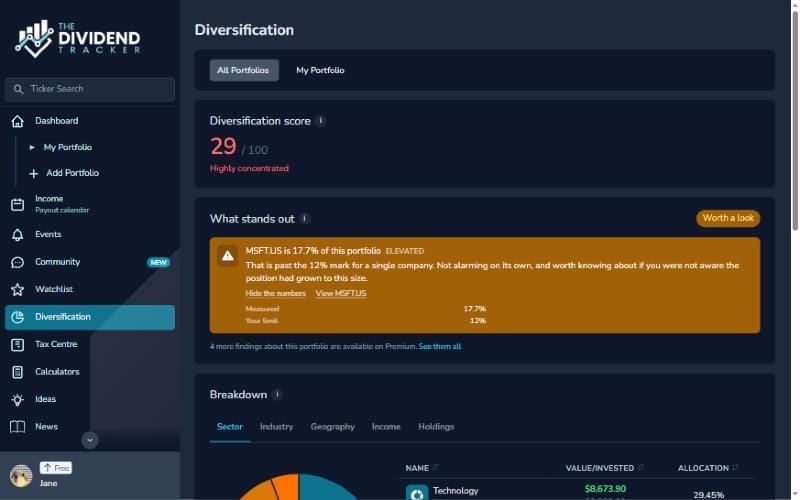
Snowball Analytics lets you set target allocations for holdings or categories. The rebalancing tool shows how far each holding is from its target weight and how new cash could be split to close the gap; on paid plans it also covers sales. “Find the Dip” highlights holdings that are below their target, which helps you plan where new cash goes. TDT does not list a rebalancing tool; it offers income goals, diversification views and, on paid plans, calculators for future value, DRIP and fund overlap instead.
International portfolios
If you hold stocks outside the US, Canada and the UK, coverage matters. Snowball Analytics tracks assets in 30+ currencies across 70+ exchanges, and you can view results in the currency of your choice. TDT's FAQ says it supports US, Canadian and UK exchanges and currencies.
Extras worth knowing about
TDT sends dividend alerts by push, SMS or email, and includes a community where members share ideas and verified holdings, plus ChatGPT and Claude integration on paid plans; Pro adds API access and webhooks. Snowball Analytics offers public portfolios from other investors, backtesting on every plan, and an AI integration on its Expert plan.
Free and paid plans
The Dividend Tracker free plan
One portfolio with up to 10 holdings, CSV import, basic dividend tracking and a limited payout calendar. Broker auto-import, Dividend Grades and advanced metrics require Premium.
Snowball Analytics free plan
One portfolio with up to 10 holdings, broker report import, the dividend calendar, advanced cash accounts, limited benchmarking and a purchases-only rebalancing tool. Linking a brokerage account and the Dividend Rating start on the Starter plan.
Paid plans
The entry plans are close in price: Snowball Analytics Starter is $7.99 a month or $79.99 a year, and TDT Premium is $8.99 a month or $89.99 a year. They differ in scope: TDT Premium includes 10 portfolios, while Snowball Analytics Starter includes 1 and its 10-portfolio Investor plan is $14.99 a month or $149.99 a year. Compare the plan that matches the number of accounts you track.
The way to try them differs too. Snowball Analytics paid plans come with a 14-day free trial (up to 2 portfolios during the trial). TDT has no trial but offers a 14-day money-back guarantee on upgrades.
Which one fits you?
Your holdings are mainly US, Canadian or UK stocks, your priority is following dividend income and alerts, and you value a dividend-investor community, several portfolios on the entry plan and AI-assistant integration.
You hold assets in several currencies or on non-US exchanges, want performance figures such as IRR alongside income, and want a rebalancing tool for target allocations and backtesting on long historical data.
How we compared: this comparison is written by the Snowball Analytics team. Features and prices were checked against each company's website, help pages and app store listings on October 21, 2026.
This article is for general information only and is not financial, investment or tax advice. Dividend scores and income estimates are not recommendations to buy or sell any security. Backtests use historical data and are hypothetical; past performance does not indicate future results. Investing involves risk, including loss of capital. Product features and prices may change. Snowball Analytics is not a broker or a registered investment adviser. Tickers and portfolios shown in screenshots come from a demo portfolio and are examples, not recommendations. The Dividend Tracker is a trademark of its owner; Snowball Analytics is not affiliated with or endorsed by The Dividend Tracker.