You have successfully signed up for the Snowball Analytics service and are now ready to take control of your financial future. Thank you for letting us be a part of your journey to financial independence. Welcome to our service 🥳
This guide will walk you through your account setup, you will learn how to:
- Add and track your investments
- Get valuable insights into your performance
- Add multiple portfolios
- Get overview of all investments on one screen
Add your investments
How to add and track your investments in Snowball Analytics
Immediately after your registration we will automatically create your first portfolio. You will be able to change it’s name and settings later on the Portfolio Management page.
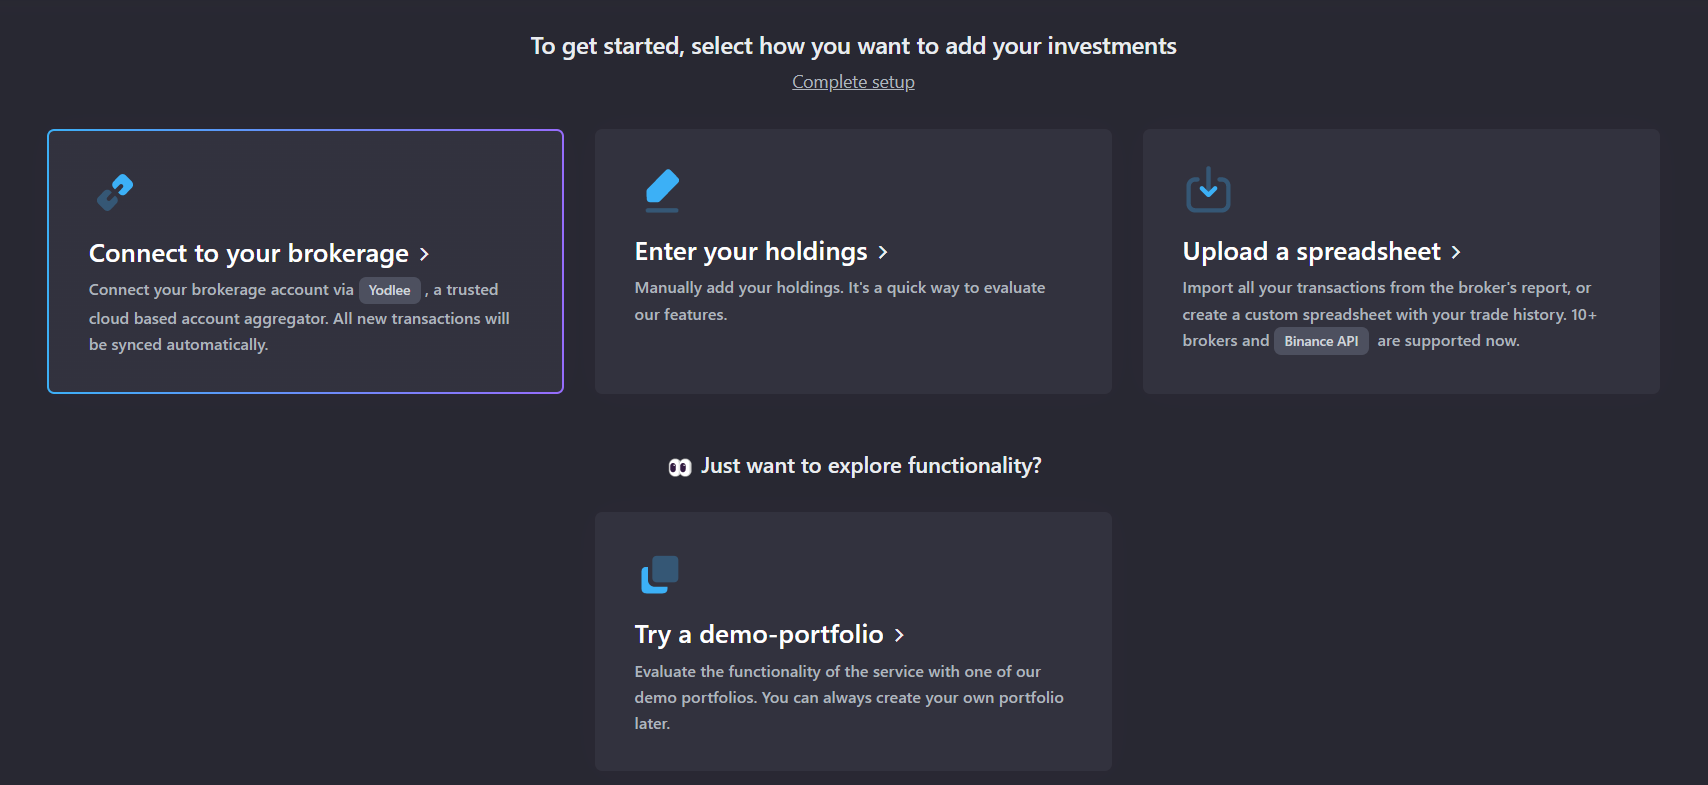
Connect your brokerage account
The easiest way to keep your portfolios up to date is connecting to your brokerage via Yodlee. Your holdings and transactions will import and sync automatically every night.
More information about automatic brokerage connections can be found here.
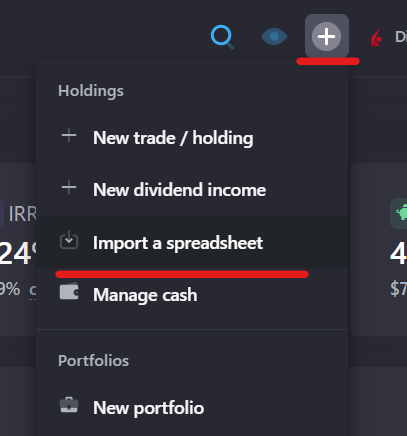
Import broker's report
Brokerage didn't connect? No worries. You can check if you can import broker's activity report - all trade and dividend history will be imported from the report automatically.
Currently supported list of supported brokers can be found below. We constantly add new brokers to this list, so you might want to check directly in the service.
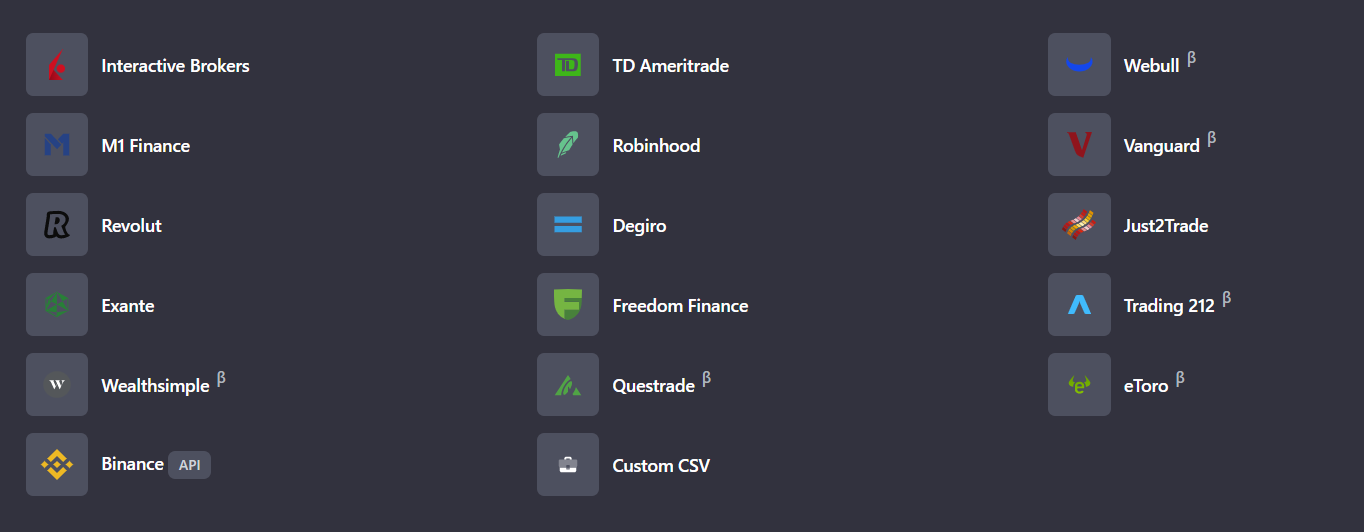
- Select your broker
- Click on "How to get a broker's report" and read the instruction
- Download the report from your broker
- Import the report
- Please note, that you need to upload statements from your first transaction date. Some brokers limit maximum period of the report to 1 year. If you invested for more than 1 year, download all reports (one for each year) and upload all reports from older to newer.
After the report is imported, a message with the information about the successful import (or about possible issues) will be displayed.
Later, when you'll start making new trades or receive dividends you can just get new statements from the date of your last import and upload them here. You can access this page via Quick Actions menu on the top panel.
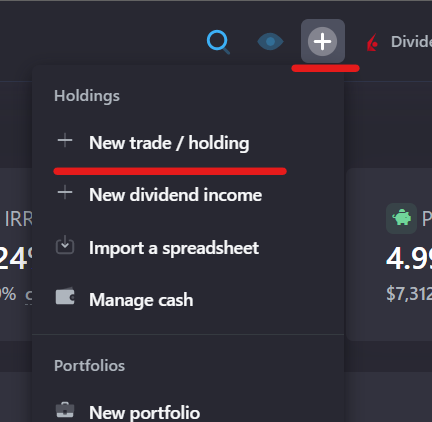
Add holdings manually
You can also add all your holdings/trades manually. This method is suitable for those who don't have a lot of trades and holdings.
In our service you can add your investments either trade by trade, or by simply adding current amount and average cost of your holdings. The difference between these two approaches explained here.
Later, when you'll start making new trades or receive dividends you can add them on the Portfolio -> Transactions page. You can quickly access this page via Quick Actions menu on the top panel.
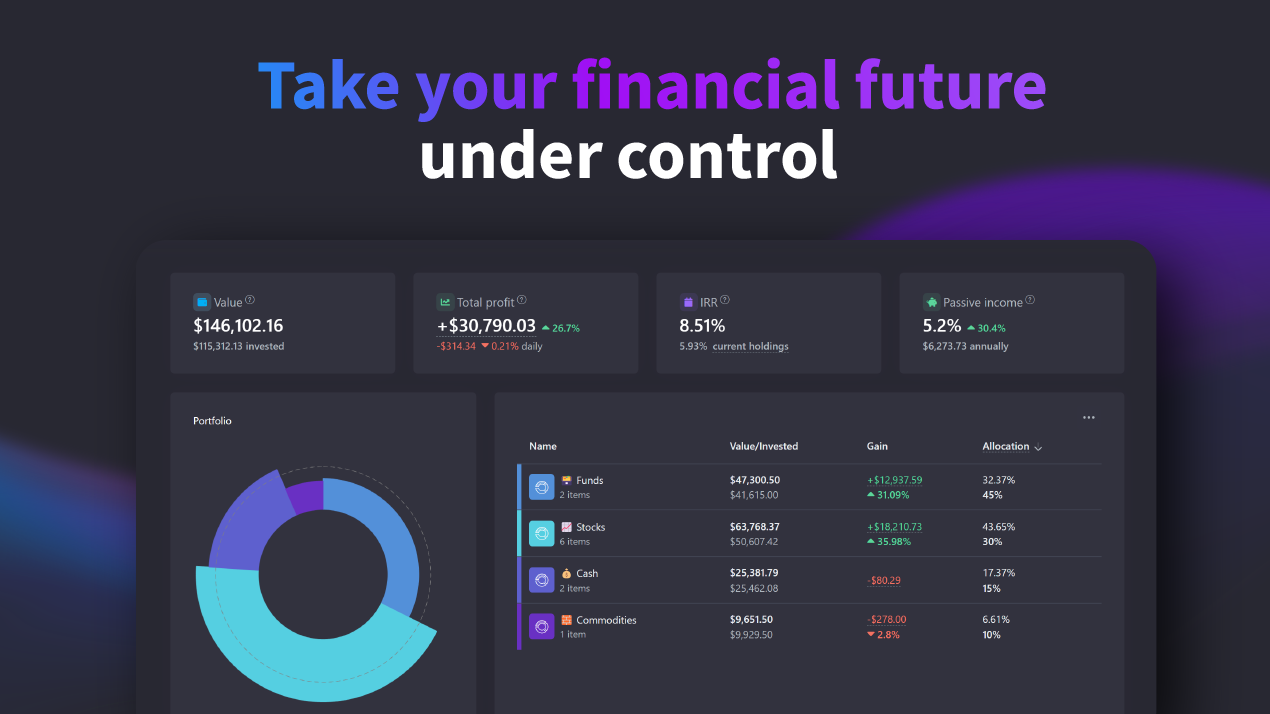
Get valuable insights into your performance
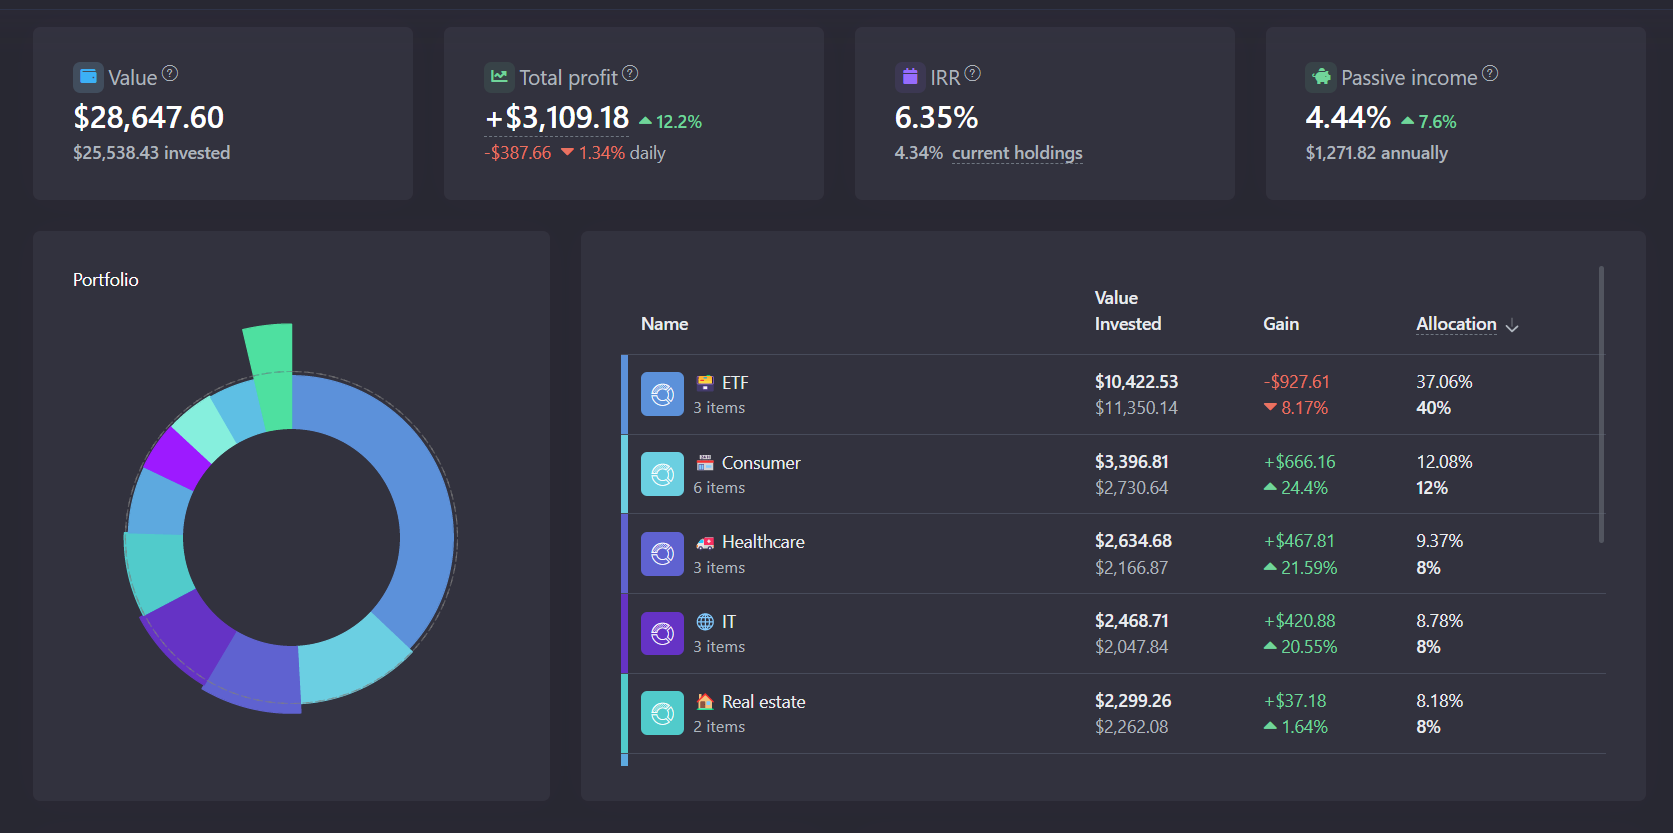
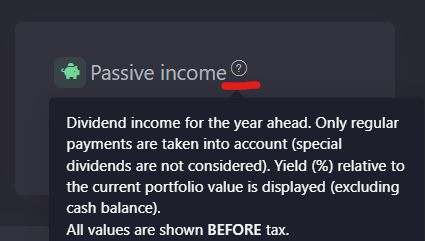
Once you've added your investments to the service it will automatically calculate your performance, passive income and other metrics.
Start your journey from Dashboard and Analytics pages.
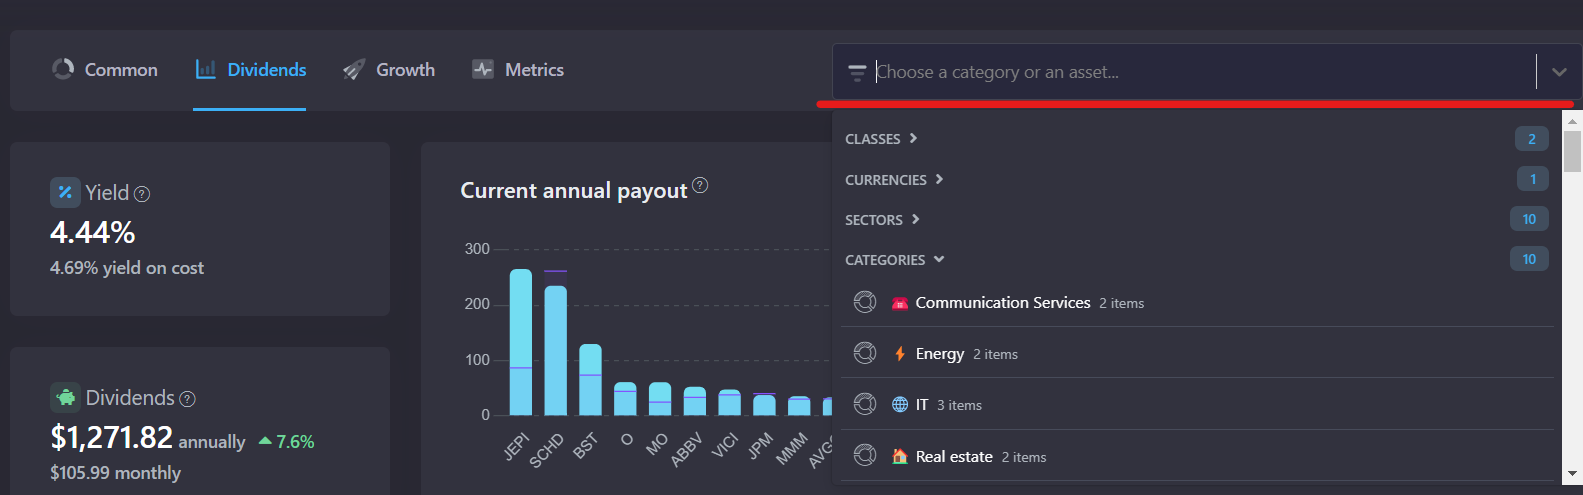
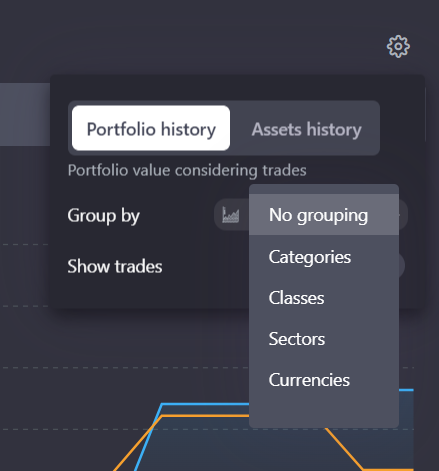
You'll notice you can filter and group Analytics page by different parameters. This can be useful if you want to compare different asset classes/sectors/categories or view analytics separately for each one of these groups.
Add multiple portfolios
When you need to add a second brokerage account click on your current portfolio name on the top panel, then on "Add portfolio" button.
Then you can edit/delete/reorder your portfolios on the Manage portfolios page.
Get overview of all investments
To get a quick overview of your portfolios go to Dashboard -> All Portfolios screen.
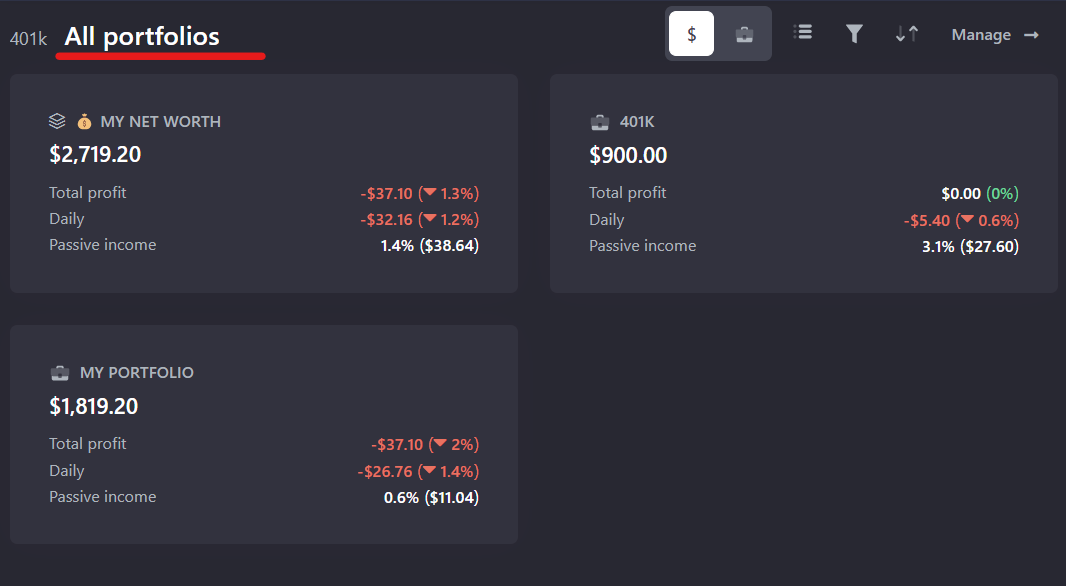
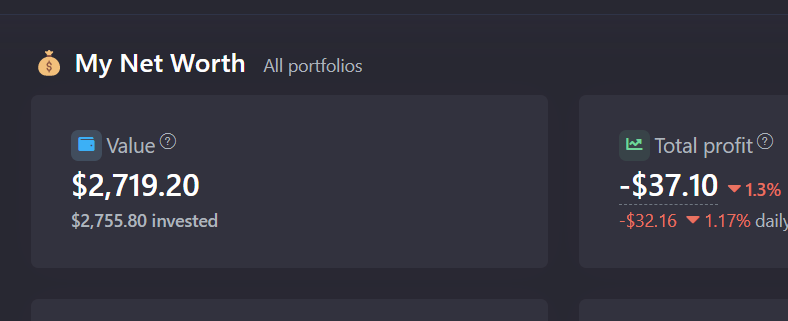
You can get consolidated analytics for multiple portfolios with a Composite portfolio. When you add a second portfolio to your account we automatically create a composite portfolio for you called "My Net Worth".
It "contains" all data from your portfolios and you can use it to view statistics and analytics for multiple portfolios at once.
What's next?
Learn how to use Snowball Analytics on mobile device:
 Snowball Team
Setup your categories and target allocations:
Snowball Team
Take a look at the overview of the features of our service:
Snowball Team